


1) Economic Activity and Energy
4.1A:
Key Vocabulary:
Globalisation: The increasing interconnectivity and independence of of nations and its people across the globe
Raw Materials: Items which more complex items are made from (e.g. coal, iron, limestone)
Economic Sector: The type of jobs that people do, and it is categorised into: Primary, secondary, tertiary, and quaternary
Sectoral/ Economic Shift: The change from one economic sector to another as the economy develops and the relative importance of each sector decreases while the next increases
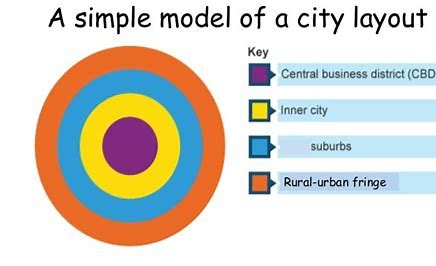
Decentralisation: When people for businesses, particularly tertiary activities have been moving out from the CBD and inner city to the suburban ring and into the urban fringe
Informal Sector : These jobs are often unskilled and labour intensive, require little money to set up, offer no protection to the workers and they pay no tax as there is little or no control by the government
Underemployment: When you have a higher skillset or qualifications for the job you are working
Unemployment: When you do not have a job
Paratransit: Unregulated and unregistered transport services, including taxis and buses
LIC: Low income country
HIC: High income country
Energy Efficiency: When energy, such as electricity, more carefully and less wastefully to reduce overall use (and reduce pollution).
Energy Conservation: any behaviour that uses less energy
Renewable Energy: Types of energy sources that can be used over and over again and is not finite
Non-Renewable Energy: These are resources that cannot be replaced in our lifetimes and are finite
Energy Gap: When a country cannot meet its energy demand with its resources, it has an energy gap (energy production is lower than energy demand)
Energy Mix: Combination and proportion of primary energy sources used to meet a country’s energy demand every year; how a country meets its energy needs
Primary Sector:
Part of the economy that extracts and produces raw materials from nature
Industries such as farming, logging, fishing, forestry and mining
Provides food, fuel + materials for other sectors
Dominant in developing countries and not in developed countries as it employs a larger share of the workforce and contributes more to GDP
Secondary Sector:
Part of the economy that is concerned with manufacturing
Converts raw materials from primary sector into new products
Vital for converting raw materials into products for other sectors and consumers
Examples: car manufacturers, food production
Tertiary Sector:
Industry that provides a service, this is done by people or businesses for consumers
Examples: hairdressers, banks, supermarkets or cinemas
Quaternary Sector:
Concerned with information, communications, research and development
Is also a service sector
Tertiary and Quaternary Sector make up the largest part of the UK economy, employing 76% of the workforce
Clark Fisher Model:
 Changes Over Time:
In the Pre-Industrial section of the Clark Fisher Model the primary sector is the greatest sector at 70% but is on a steep decline to 45% by the end of the pre industrial era. This is in contrast to the second highest sector, the secondary sector which is at 25% in this era and steadily rises to approximately 35-37% by the end of the pre-industrial era. The tertiary sector is the smallest sector at 10% but similarly to the secondary sector it gradually rises and is at 20% by the end of the era. The quaternary sector does not exist yet.
In the Industrial section of the Clark Fisher Model the secondary sector is the greatest sector at 50% at the beginning but declines steadily to approximately 37-38% at the end of the era. However, the tertiary sector is at a steep incline throughout this era and dominates this era at 60% by the end. The primary sector remains on a steep decline and has the lowest percentage of employment and is at 15% by the end of the era. The quaternary sector still does not exist.
In the Post-Industrial section of the Clark Fisher Model the tertiary sector gradually increases until 65% but remains the highest percentage of employment. The secondary sector is at a steep decline and falls to 20%, the primary sector remains on the decline to 8-10% meeting the new quaternary sector which is on a gradual incline reaching 10%.
Employment Structures in Countries of Different Levels of Development:
Developing countries generally have the highest percentage of employment in the primary sector as most people are working agricultural jobs, this means that the countries GDP is heavily reliant on agriculture as it is low skilled and easy to work. However, tertiary and secondary sector jobs are on a steady incline but aren’t the dominating sectors due to poor infrastructure and little use of machinery.
Example: Nepal - Primary sector = 81%, Secondary sector = 3%, Tertiary sector = 16%
As countries continue to develop and enter the emerging stage of development, countries gain an industrial base. The secondary sector increases due to mechanisation in agriculture reducing the number of jobs in the primary sector, causing rural to urban migration as people find jobs in the factories and in the tertiary sector. The primary sector decreases more and the tertiary sector increases as well due to this urbanisation
Example: Mexico- Primary sector = 14%, Secondary sector = 25%, Tertiary sector = 61%
When a country enters the developed stage there is a greater increase in mechanisation and the occurrence of deindustrialisation which reduces the jobs in the secondary sector and primary sector. But as more people enter the middle class and become richer as they have a higher GDP they have more expendable money to spend on services such as education, healthcare and tourism and to meet this increase in demand the tertiary sector grows even more. As the country has more money to spend, money is invested into research and the development of technology and thus leads to the funding into researchers and IT, causing the quaternary sector to grow steadily
Example: UK- Primary sector= 1.5%, Secondary sector= 18%, Tertiary sector = 80.5%
4.1B:
Factors Affecting the Location of Economic Activities:
 Physical factors:
Accessibility - near transport routes (rivers and ports initially, now roads, rails and airports)
Land - flat land with room to expand; modern factories have decentralised(moving from CBD and inner city ring to suburbs and the urban fringe) to locations outside of cities
Power - water power and electricity from national grid
Raw materials - old, heavy industry required large amount of bulking raw materials
Socio-economic factors:
Communications - Infrastructure improved transport and modern communications (access to internet, phones). Greater freedom of choices over their location
Government - tax incentives, cheap rent and other benefits encouraging companies to locate in depressed areas of the country (e.g. South Wales)
Labour supply - quaternary industries in the UK are found near the university towns of Oxford and Cambridge to attract knowledgeable graduates
Markets - access to markets is vital as it allows for the ease of selling and transporting your product
Best Locations for Certain Economic Activities:
Commercial Farming (primary sector) - Basic raw materials, suitable soil, good climate conditions
Heavy Industry (secondary sector) - Raw materials are vital, nearness to places where transport is accessible (e.g. near sea dock, main road)
Retailing (tertiary sector) - must be accessible to customers and clients (e.g. near a main roads connected to lots of different urban areas), also in an area where the corporation can employ people
Software design (quaternary sector) - can be anywhere, near motorway for easy access for workers though
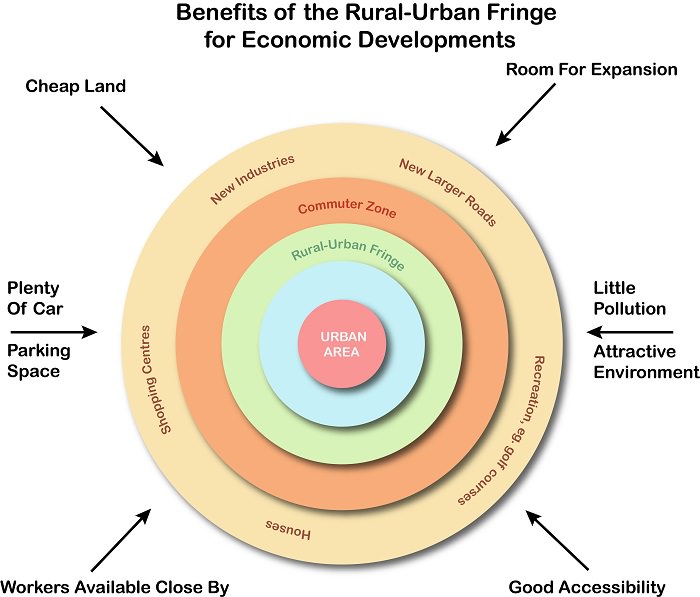
Benefits of Urban Fringe (+ Reasons for Decentralisation):
cheap land
Room for expansion
Good accessibility
Attractive environment, little pollution
Workers and work available close by
Plenty of car parking space
Negatives of Urban Fringe:
Bad accessibility to customers
Poor infrastructure
Hard to transport into area
4.1C:
Reasons Behind Changes in Sectors:
Increasing mechanisation in agriculture led to a decrease in the jobs available
People moved to urban areas to find jobs in secondary and tertiary sectors
Increasing mechanisation and global changes led to a decrease in secondary employment in some countries
Technological improvements have led to an increase in tertiary and quaternary employment
Raw Material:
Raw materials may have run out or be economic unviable to obtain
Crop production and livestock may be reduced due to drought, flood, pest/disease or soil erosion
Improvements in technology may reduce the amounts of raw materials needed
Globalisation:
Globalisation is being ‘pushed’ on to the world through better transport- people can travel and educate themselves about other countries as well as products coming in from numerous countries such as China, Bangladesh. This is also done through TNCs as they contribute to globalisation as well as they are brands from one country to a multitude of others. Communications improvements has furthered globalisation as we can communicate to others and send information within seconds increasing the links between each country.
China’s ‘competitive advantage’ is that it has cheap manufacturing this has driven car manufacturing from the UK to China for example.
The US’s ‘competitive advantage’ is that it is a global superpower with a good economy allows them to trade easily with other countries and gives them the opportunity to invest in other countries which many do not have the ability to.
Government Policy:
How do ‘Enterprise Zones’ work:
100% business rate relief in 5 years
Tax relief on capital spending on machinery
Derestricted planning permission
All revenue from business rates stays in the local area to be reinvested.
Investment in transport infrastructure
Overall, this would attract more foreign investment which would boost the economy as there would be more jobs and businesses across the UK.
4.2A:
Developed Country Economic Sector Shift:
The UK had a Sector Shift because of it’s high GDP it has a better economy which means that there is more expendable money for people in the middle class. This increase in expendable money on luxuries causes a higher demand for services (tertiary sector) meaning less people need to work in the primary and secondary sector.
The Government policies in the UK encourage services and thus drives the increase in the tertiary sector.
Shift = Tertiary increase. Secondary and Primary decrease
Positives:
Has created more jobs in tertiary sector
The tertiary sector generates 75% of the national economic wealth
Negatives:
Deindustrialisation meant that large urban areas that had factories were left in bad economic states. This means that these cities survival is difficult and expensive
Huge rise in unemployment due to no factory work as machines do it instead
Emerging Country Economic Sector Shift:
China has a high population which gives them a large labour force
This large labour force gives China lots of cheap labour and is attractive to foreign investors
China’s “open door” policy allowed lots of foreign investors which created lots of secondary sector jobs
Shift = Secondary and Tertiary increase. Primary decrease
Positives:
Created more employment and decreased poverty for millions across China, created positive multiplier effect
People in China have more money due to the fact more people can get jobs
Higher GDP in China as their exports have increased significantly
Negatives:
Millions of children are left behind in rural areas with their grandparents as their parents are in the cities for work
Parents can be gone for a years at a time causing children to be raised by their grandparents
Increase in pollution due to the increase in Industrialisation from the increase in factories
Pollution has also lead to an increase in health problems and environmental damage
Developing Country Economic Sector Shift:
Ethiopia has had more foreign investors take interest in cheap labour and TNCs have set up factories there
The government has invested in the countries infrastructure, improving road networks and the supply of energy. This is attractive to TNCs and their arrival will lead to more jobs available.
Positives:
Improvement in the quality of life and living standards for some Ethiopians
Creates opportunities for young Ethiopians, this opportunity was not available to them before the sector shift
Negatives:
Growth of commercial agriculture has taken the land that was used for subsistence farming
Increasing food shortages in a country with a history of famines
4.2B:
Informal Employment:
Developed countries (UK) have a small share of informal employment, it is around 20%
Developing countries, particularly in Africa have a high percentage share of informal employment - 90% and over
Informal employment typically occurs in Low Income Countries or megacities
No taxes must be paid
The government does not regulate the work in this sector
It helps reduce poverty
Has no “benefits” that a formal job would provide
The informal economy can be very large and support many people
Examples: Shoe shining, food stands, car washing, cleaners
Jobs in the formal sector exist because:
There are areas of high unemployment because high populations produce lots of competition for jobs
Most people live in informal settlements
Many have migrated from rural areas meaning that they would have lower skills and a poorer education (rural to urban migration)
If the country is not very developed
Other jobs are poorly paid and so the informal sector can boost one’s income
If there aren’t many job opportunities
Signs of the informal sector:
Layout hints to absence of sanitation
No branding on food
Location - if it is not in a building or if it is randomly paced in a road then the government can’t track it
Unlikely long term presence in that area - can tell from layout
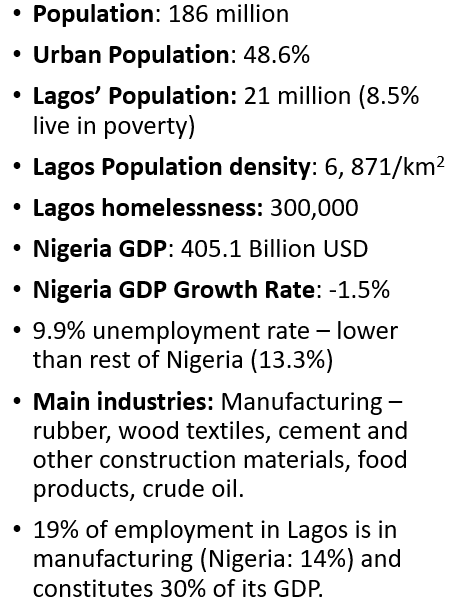
Megacity = Lagos
Positives of the Informal Sector:
Some jobs are needed for people to provide for their family and their own domestic income
People keep 100% of their money - meaning the worker’s profit margins are what they sell as they do not have to pay taxes
Positive multiplier effect will occur, thus improving the local economy
People with no education or a low skillset can have their own source of income
Cheap services meaning that the consumer pays less which benefits them
Negatives of the Informal Sector:
Unstable income as it depends on the weather and customer flow (tourist season) as this can lead to fluctuations in their income, meaning that their income is unreliable as they are vulnerable to shocks
Bad for the government as the jobs in the informal sector are untaxed and the government cannot collect funding for improvements in the country as they receive less taxes
No health or safety regulations due to no government regulations meaning that workers are susceptible to diseases as well as customers, particularly if food is ordered
Absence of long term planning meaning the workers do not have any safety for the future and might not make any money for long periods of time
Case Study: In Nigeria there is a high informal sector of 40%
4.2C:
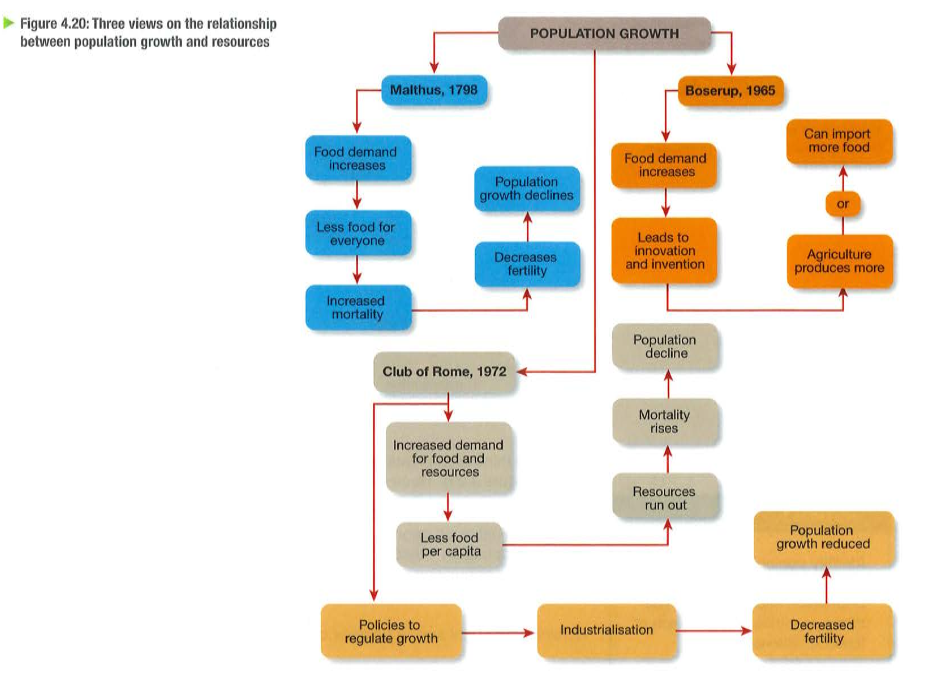
The Relationship Between Population and Resources:
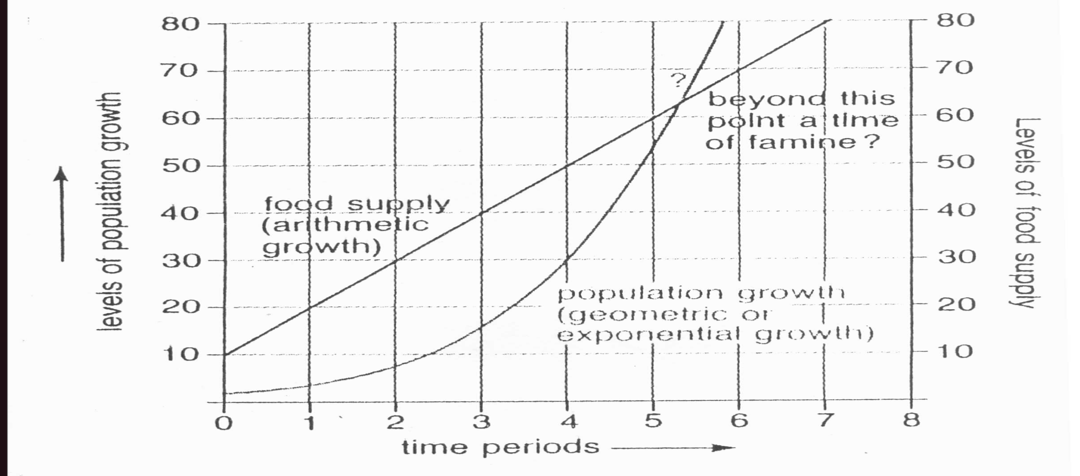
The Malthusian theory regarding population was pessimistic and based on two principles:
Human population if unchecked would grow at a geometric rate, whilst food supply will increase at an arithmetic rate
Malthus argued that population growth proceeded at a faster rate than the increase in food supply
This meant that there would be a time where there was not sufficient food to feed the population, he believed that this would cause population growth to stop through a lower birth rate or an increase in mortality due to disease, famine and war (he warned people of this)
Malthus wrote his views on population and resources before the Industrial revolution which resulted in the production of pesticides and fertilisers. Without this information Malthus did not know that the amount of food produced per acre of land is much higher now than it was then
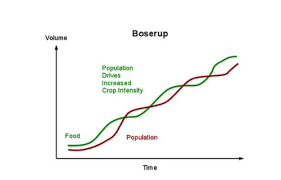
The Boserup theory was optimistic and strongly believed that food supply would always accommodate population growth
She believed that humans will always invent new ways to increase our resource supply and that food resource can keep up with our population growth
So as the population grows, food demand will increase but according to her theory this will encourage innovation and invention. Thus leading to agriculture producing more food or us importing food, she described this change as “agricultural intensification”
Boserup’s theory includes her own knowledge of farming in a developing world and argued that the threat of starvation and feeding more people will motivate people into improving their farming methods and inventing new technologies to produce more food
4.3A:
Energy Demand and Production:
When a country has an energy gap the country must import energy to meet the demand and are not energy secure
The UK has an energy gap as they are reducing their reliance on fossil fuels but cannot fully rely on renewable energy
Therefore, it is easier for the UK to import fossil fuels than use their own
This is a problem if the countries that export to the UK limit their exports for a political reason or if their country is unstable
Wealthy developed countries tend to consume lots of energy because they have a higher standard of living
Poorer less developed countries tend to consume less energy because they are unable to afford as much
Energy Demand is affected by:
Rising population
More people are using products and appliances that require energy, increasing energy demand
Economic development
As countries develop, activities such as manufacturing products and transport become more important and are carried out on a larger scale. These require energy and increase the energy demand
Increased wealth
Increase in disposable income means more appliances bought for one’s leisure and these require energy thus increasing the demand
Technological advancements
Increase the amount of products that require energy, therefore increasing the demand
Urbanisation
Higher demand for transport
High intensity agriculture
More energy is required for machinery
Energy production is affected by:
Global distribution of fossil fuels being uneven
Fossil fuels are the main energy source of the world but use of renewables are increasing
Production of energy varies between countries
Developing countries produce less energy as their demand is lower as they have less appliances
Lack of money make it difficult to access energy
Lack of machinery make it difficult to produce energy
Countries with supplies of fossil fuels produce more energy
Countries that rely on imported energy may produce less because the imports account for some of their energy demand
Non- Renewable and Renewable Advantages and disadvantages:
Type of energy(R or NR) | Advantages | Disadvantages |
Coal NR | ● High world reserves- Lots of it left for us to discover ● Newer mines | ● Pollution ● Responsible for global warming ● Mining is dangerous ● Heavy to transport |
Oil NR | ● Variety of uses ● Easy to transport ● Less pollution than coal | ● Low reserves ● Air pollution ● Danger of spills ● Explosions |
Natural Gas NR | ● Least pollution from fossil fuels ● Easy to transport | ● Explosions ● Some air pollution |
Solar R | ● Can be used in the majority of the world ● Clean and efficient ● Can be built into buildings ● Unlimited Supplies | ● Expensive ● Requires sunlight cloud/night results in less solar energy produced ● Lots of energy required for development and money for photovoltaic cells |
Wind R | ● Clean ● No air pollution ● Can be a large scale scheme or a small scale scheme ● Cheap to run | ● Wind is unpredictable ● Visual and noise pollution ● Many turbines are needed to produce sufficient amount of energy |
Hydro-electric power R | ● Very clean ● Controls flooding ● Often in remote areas ● Provides water in times of shortages | ● Flooding ● Silt trapped behind dam ● Visual pollution from pylons and dam |
Geothermal R | ● Many potential sites | ● Sulphuric gases ● Expensive to develop ● High temperature can cause maintenance problems ● Most potential sites are in volcanic areas |
Biofuel R | ● Widely available- in LICs ● Uses waste products ● Can be used at a local level
| ● Can be expensive to set up ● Some pollution ● Waste cannot be recycled |
4.3C:
Energy can be managed in a Sustainable Way through Education, Efficiency and Conservation
Energy Efficiency is using energy, such as electricity, more carefully and less wastefully to reduce overall use (and reduce pollution).
The government could:
Invest in renewable technologies such as wind and solar
Invest in public transport
Encourage a switch to electric cars
Make building regulations to ensure that new homes are energy efficient
Energy Conservation: any behaviour that uses less energy
Installing solar panels- saves the amount of energy used
Insulating walls (cavity wall insulation) and roof spaces (loft insulation)- reduce heat loss
Install double or triple glazing to reduce heat loss
Use a smart metre or LED light bulbs
Install energy efficient appliances
The public has become more conscious in regard to the use of energy- through education people take their energy usage into consideration and try to reduce it
Case Study of Energy Resource Management in Nepal (micro-hydro, wind and solar)
Nepal is a poor country with a low demand for energy but the country has an increasing demand for energy and the country struggles to develop.
Fuelwood was the traditional source of energy for heating and cooking which led to deforestation- biomass is used as fuel for cooking
Nepal does not have many fossil fuels and importing fossil fuels is hard and expensive as it is a land locked and a mountainous country
Nepal used micro-hydro plants for a better and a more reliable source of energy
The plants are run and built by the local communities
These schemes do not need a dam or reservoir to be built, it simply diverts water from a stream and removes the damaging sediments and then allows the water to fall on a turbine which powers a generator that will provide electricity for a small community
This system is a low cost way to produce electricity and don’t damage the environment.
1000 micro hydro plants have been built in 52 districts, meeting the energy needs of many rural communities
This is not the only scheme that can benefit Nepal and their attention has turned to wind schemes but the wind gusts so strongly that it risks damaging the windmills
They have also tried solar panels but the limited number of sunshine deems it less effective
The cost of wind and solar power is expensive for this country adding to the pile of issues