Tags & Description
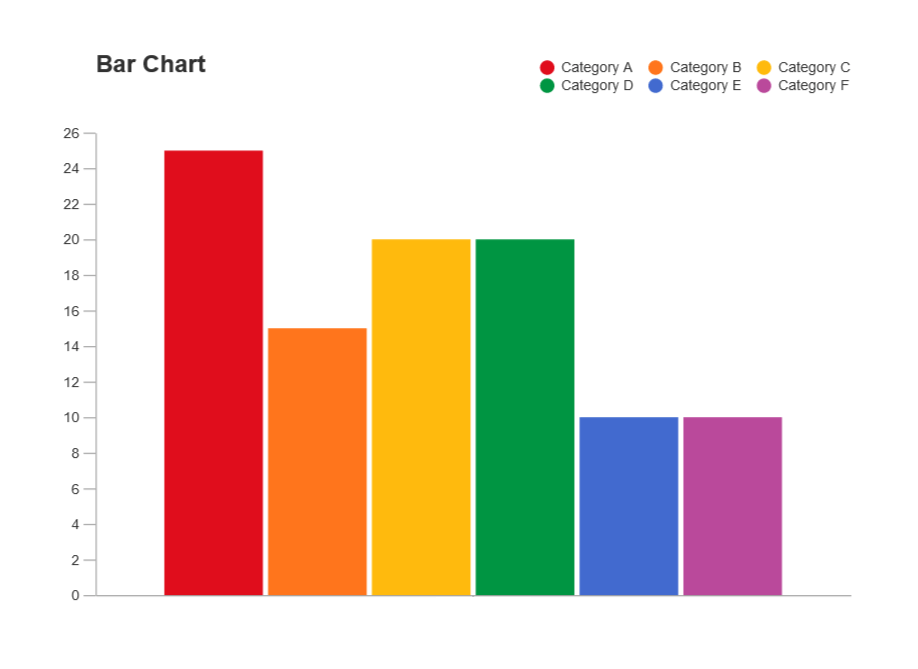
Bar Graph
a graph made of bars whose heights represent the frequencies of respective categories (chapter 2)
Bernoulli Trial
one repetition of a binomial experiment (chapter 5)
Binomial Experiment
an experiment that contains n identical trials such that each of these n trials has only two possible outcomes; the probabilities of these two outcomes remain constant for each trial, and the trials are independent (chapter 5)
Binomial Probability Distribution
the probability distribution that gives the probability of x successes in n trials when the probability of success is p for each trial of a binomial experiment (chapter 5)
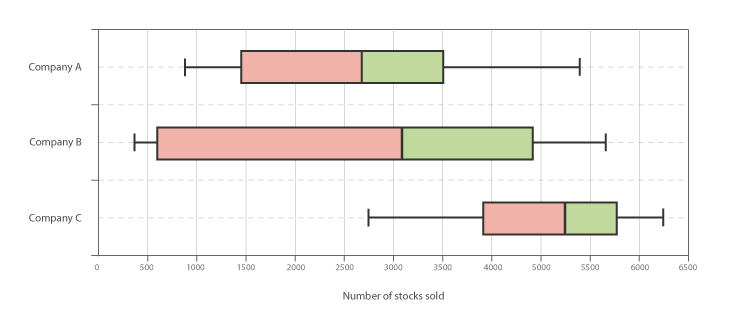
Box-And-Whisker Plot
a plot that shows the center, spread, and skewness of a data set with a box and two whiskers using the median, the first quartile, the third quartile, and the smallest and the largest values in the data set between the lower and the upper inner fences (chapter 3)
Census
a survey conducted by including every element of the population (chapter 1)
Central Limit Theorem
the theorem from which it is inferred that for a large sample size (n ≥ 30), the shape of the sampling distribution of x̄ is approximately normal; also states that the shape of the sampling distribution of p̂ is approximately normal for a sample if np > 5 and nq > 5 (chapter 7)
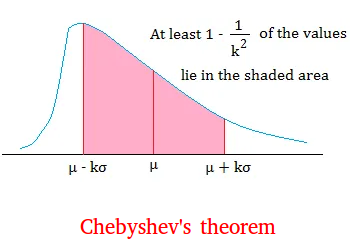
Chebyshev’s Theorem
for any number k greater than 1, at least (1 - 1/k^2) of the values for any distribution lie within k standard deviations of the mean (chapter 3)
Classical Probability Rule
the method of assigning probability to outcomes or events of an experiment with equally likely outcomes (chapter 4)
Combinations
the number of ways x elements can be selected from n elements; order of selection is not important (chapter 4)
Complementary Events
two events that taken together include all the outcomes for an experiment but do not contain any common outcome
EX: true and false, yes and no (chapter 4)
Compound Event
an event that contains more than one outcome of an experiment (chapter 4)
Conditional Probability
the probability of an event subject to the condition that another event has already occurred (chapter 4)
Continuous Variable
a quantitative variable that can assume any numerical value over a certain interval or intervals (chapter 1)
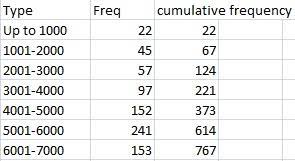
Cumulative Frequency
the frequency of a class that includes all values in a data set that fall below the upper boundary or limit of that class (chapter 2)
Cumulative Frequency Distribution
a table that lists the total number of values that fall below the upper boundary or limit of each class (chapter 2)
Cumulative Relative Frequency
the cumulative frequency of a class divided by the total number of observations (chapter 2)
Dependent Events
two events for which the occurrence of one does change the probability of the occurrence of the other (chapter 4)
Descriptive Statistics
collection of methods for organizing, displaying, and describing, data using tables, graphs, and summary measures (chapter 1)
Discrete Variable
a quantitative variable whose values are countable (chapter 1)
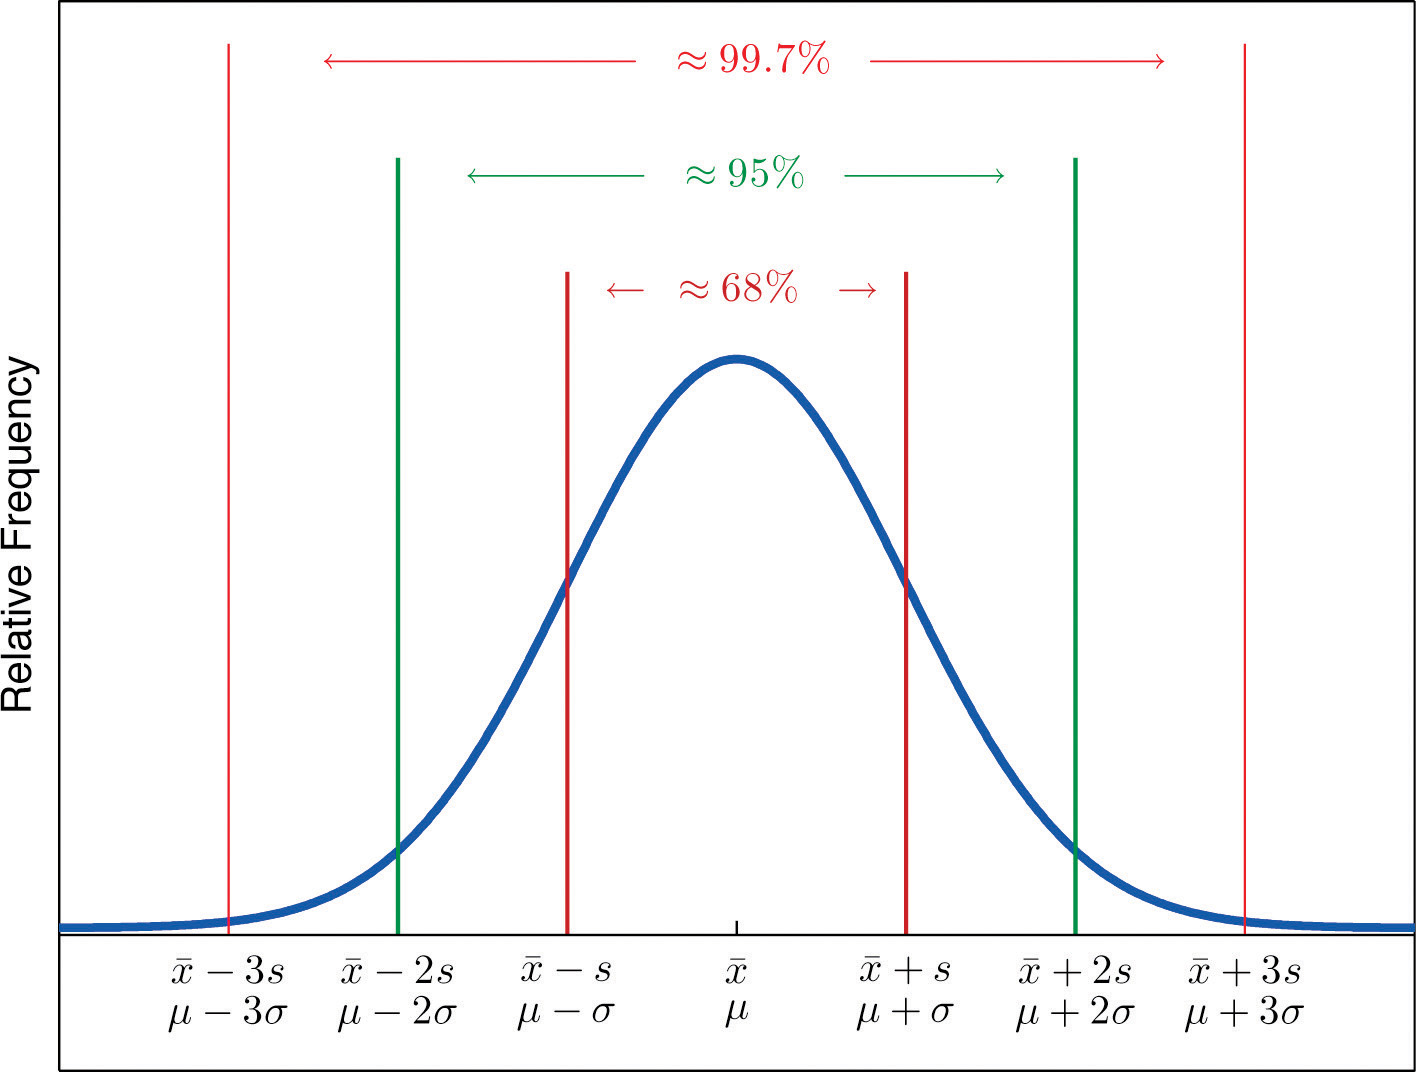
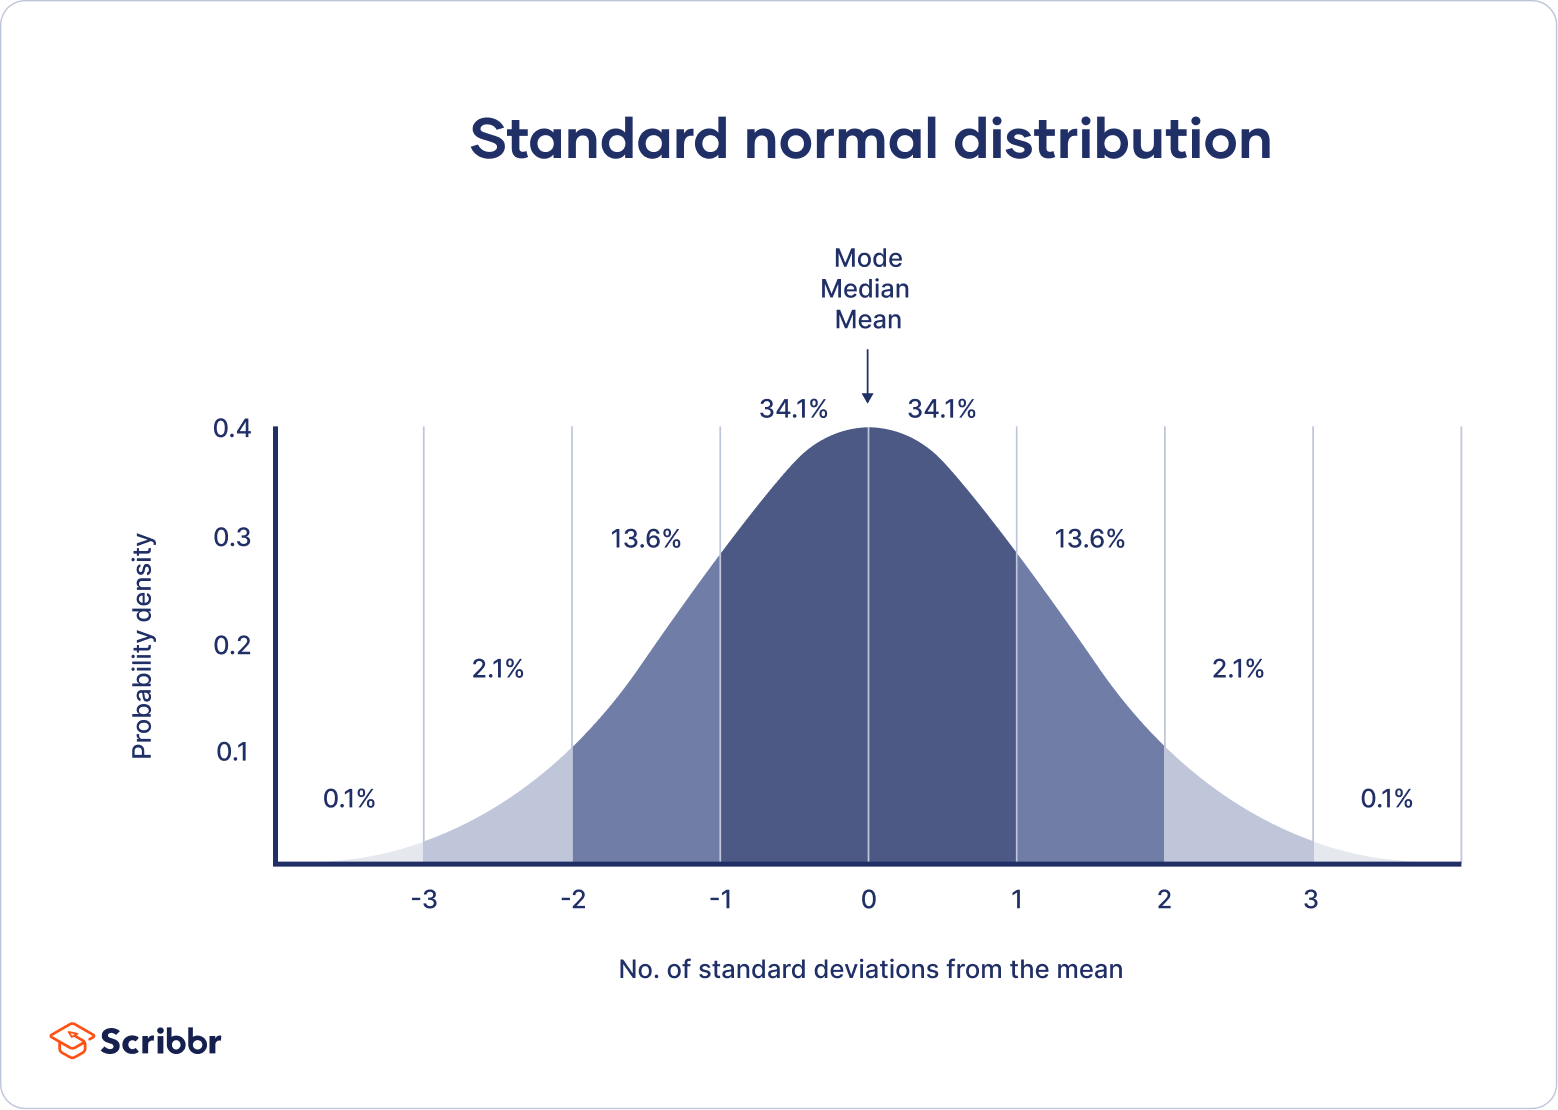
Empirical Rule
for a specific bell-shaped distribution, about 68% of the observations fall in the interval (μ - σ) to (μ + σ), about 95% fall in the interval (μ - 2σ) to (μ + 2σ), and about 99.7% fall in the interval (μ - 3σ) to (μ + 3σ) (chapter 3)
Equally Likely Outcomes
two (or more) outcomes or events that have the same probability of occurrence (chapter 4)
Factorial
denoted by the symbol !; the product of all the integers from a given number to 1
EX: n! = the product of all integers from n to 1 (chapter 4)
Frequency Distribution
a table that lists all the categories or classes and the number of values that belong to each of these categories or classes (chapter 2)
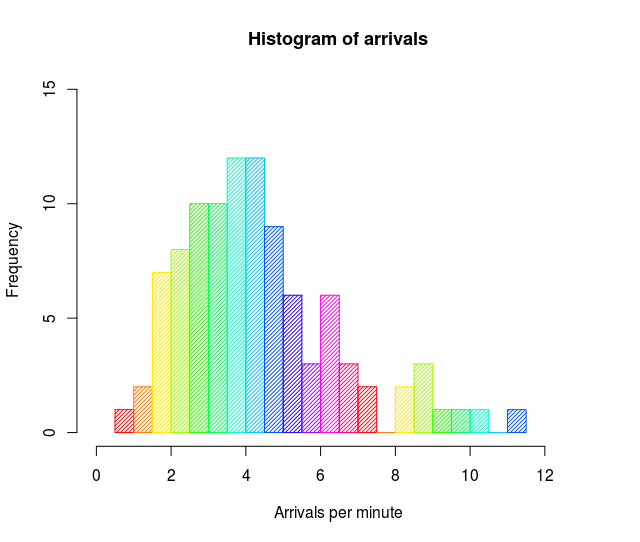
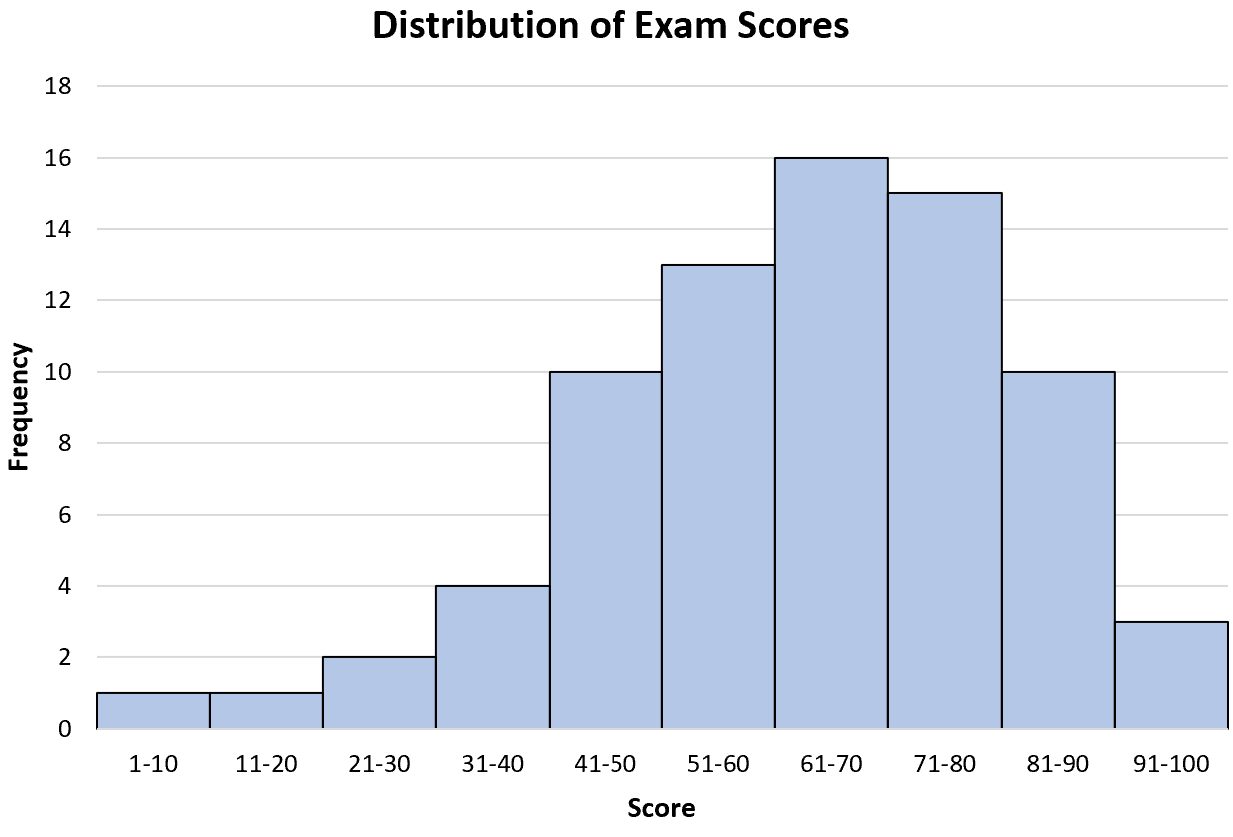
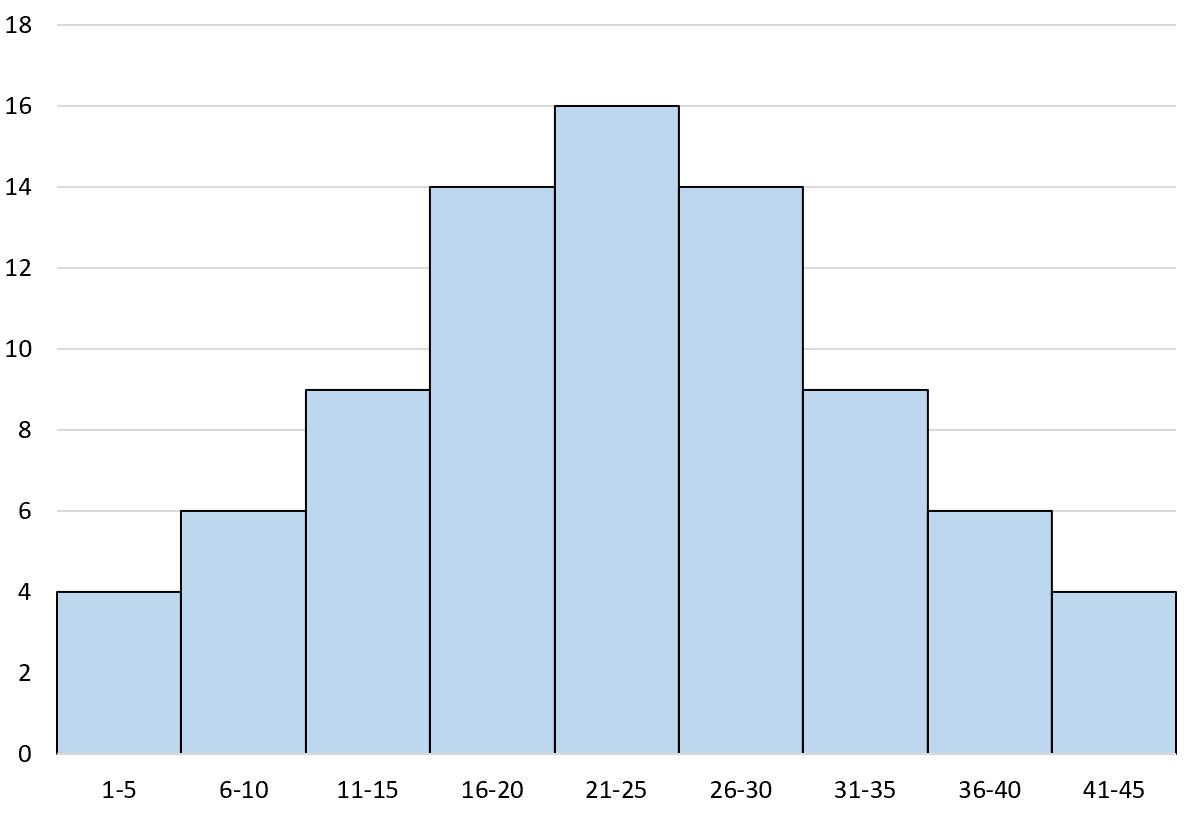
Histogram
a graph in which classes are marked on the horizontal axis and frequencies, relative frequencies, or percentages are marked on the vertical axis represented by the heights of bars that are drawn adjacent to each other (chapter 2)
Hypergeometric Probability Distribution
the probability distribution that is applied to determine the probability of x successes in n trials when the trials are not independent (chapter 5)
Independent Events
two events for which the occurrence of one does not change the probability of the occurrence of the other (chapter 4)
Inferential Statistics
collection of methods that help make decisions about a population based on sample results (chapter 1)
Interquartile Range (IQR)
the difference between the third and the first quartiles (chapter 3)
Intersection of Events
given by the outcomes that are common to two (or more) events (chapter 4)
Joint Probability
the probability that two (or more) events occur together (chapter 4)
Law of Large Numbers
theory which states that if an experiment is repeated again and again, the probability of an event obtained from the relative frequency approaches the actual/theoretical probability (chapter 4)
Margin of Error
the quantity that is subtracted from and added to the value of a sample statistic to obtain a confidence interval for the corresponding population parameter (chapter 8)
Marginal Probability
the probability of one event or characteristic without consideration of any other event (chapter 4)
Mean
a measure of center calculated by dividing the sum of all values by the number of values in the data set; denoted by μ (chapter 3)
Mean of p̂
the mean of the sampling distribution of p̂, denoted by μp̂ is equal to the population proportion p (chapter 7)
Mean of x̄
the mean of the sampling distribution of x̄, denoted by μx̄, is equal to the population mean μ (chapter 7)
Measures of Center
measures that describe the center of a distribution
EX: mean, median, and mode (chapter 3)
Measures of Dispersion
measures that give the spread of a distribution
EX: range, variance, and standard deviation (chapter 3)
Measures of Position
measures that determine the position of a single value in relation to other values in a data set
EX: quartiles, percentiles, and percentile rank (chapter 3)
Median
the value that divides a ranked data set into two equal parts (chapter 3)
Mode
the value (or values) that occurs with highest frequency in a data set (chapter 3)
Mutually Exclusive Events
two or more events that do not contain any common outcome and, hence, cannot occur together (chapter 4)
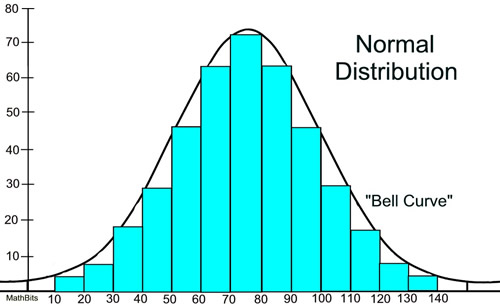
Normal Probability Distribution
the probability distribution of a continuous random variable that, when plotted, gives a specific bell-shaped curve; the parameters of the normal distribution are the mean μ and the standard deviation σ (chapter 6)
Outliers
values that are very small or very large relative to the majority of the values in a data set (chapter 2)
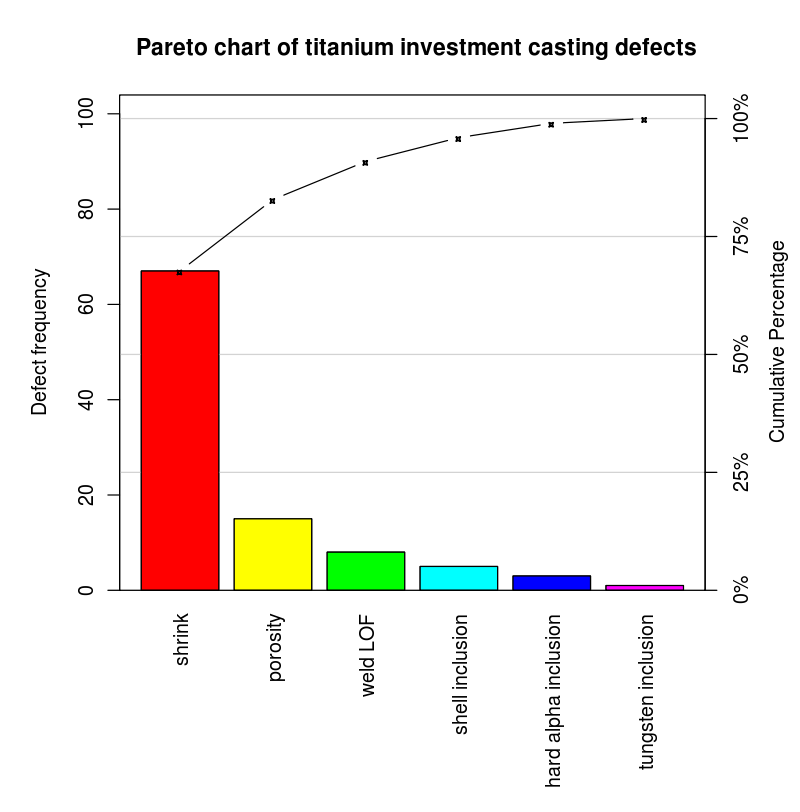
Pareto Chart
a bar graph in which bars are arranged in decreasing order of heights (chapter 2)
Percentile Rank
gives the percentage of values in the data set that are smaller than this value (chapter 3)
Permutations
number of arrangements of x items selected from n items; order of selections is important (chapter 4)
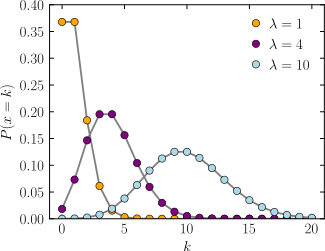
Poisson Probability Distribution
the probability distribution that gives the probability of x occurrences in an interval when the average number of occurrences in that interval is λ (chapter 5)
Population
the collection of all elements whose characteristics are being studied (chapter 1)
Probability
a numerical measure of the likelihood that a specific event will occur (chapter 4)
Qualitative Data
data generated by a qualitative variable – a variable that cannot assume numerical values but is classified into two or more categories (chapter 1)
Quantitative Data
data generated by a quantitative variable – a variable that can be measured numerically (chapter 1)
Quartiles
three summary measures that divide a ranked data set into four equal parts (chapter 3)
Random Sample
a sample drawn in such a way that each element of the population has some chance of being included in the sample (chapter 1)
Range
a measure of spread obtained by taking the difference between the largest and the smallest values in a data set (chapter 3)
Representative Sample
a sample that contains the characteristics of the populations as closely as possible (chapter 1)
Skewed-to-the-Left Histogram
a histogram with a longer tail on the left side (chapter 2)
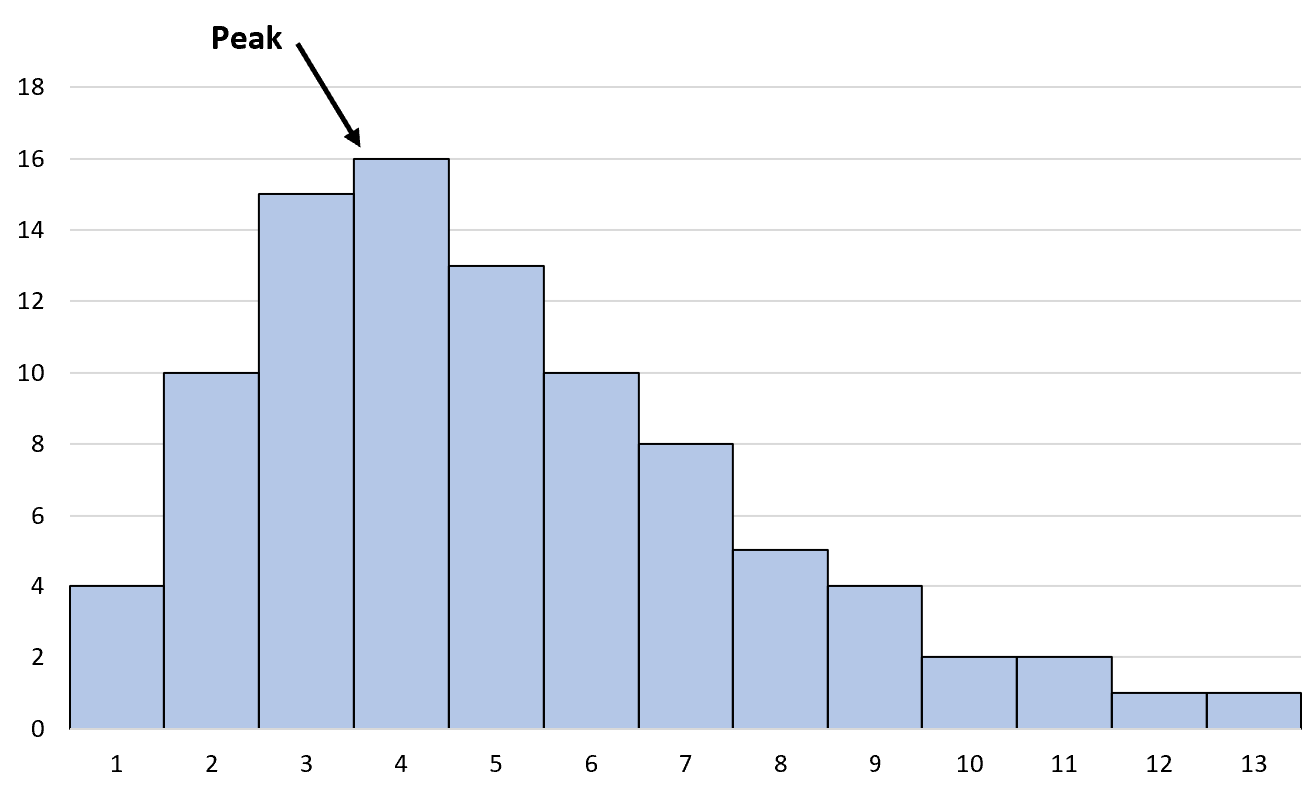
Skewed-to-the-Right Histogram
a histogram with a longer tail on the right side (chapter 2)
Standard Deviation
a measure of spread that is given by the positive square root of the variance; denoted by σ (chapter 3)
Standard Deviation of p̂
the standard deviation of the sampling distribution of p̂, denoted by σp̂, is equal to (√pq/n) when n/N ≤ .05 (chapter 7)
Standard Deviation of x̄
the standard deviation of the sampling distribution of x̄, denoted by σx̄, is equal to σ/(√n) when n/N ≤ .05 (chapter 7)
Standard Normal Distribution
the normal distribution with μ = 0 and σ = 1; the units are denoted by z (chapter 6)
Stem-and-Leaf Display
a display of data in which each value is divided into two potions– a stem and a leaf (chapter 2)
Symmetric Histogram
a histogram that is identical on both sides of its central point (chapter 2)
Tree Diagram
a diagram in which each outcome of an experiment is represented by a branch of a tree (chapter 4)
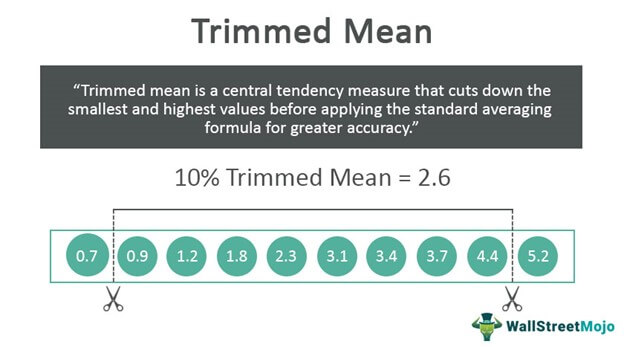
Trimmed Mean
the k% trimmed mean is obtained by dropping k% of the smallest values and k% of the largest values from the given data and then calculating the mean of the remaining (100 - 2k)% of the values (chapter 3)
Union of Two Events
given by the outcomes that belong either to one or to both events (chapter 4)
Variance
a measure of spread; related to standard deviation (chapter 3)
Weighted Mean
mean of a data set whose values are assigned different weights before the mean is calculated (chapter 3)